

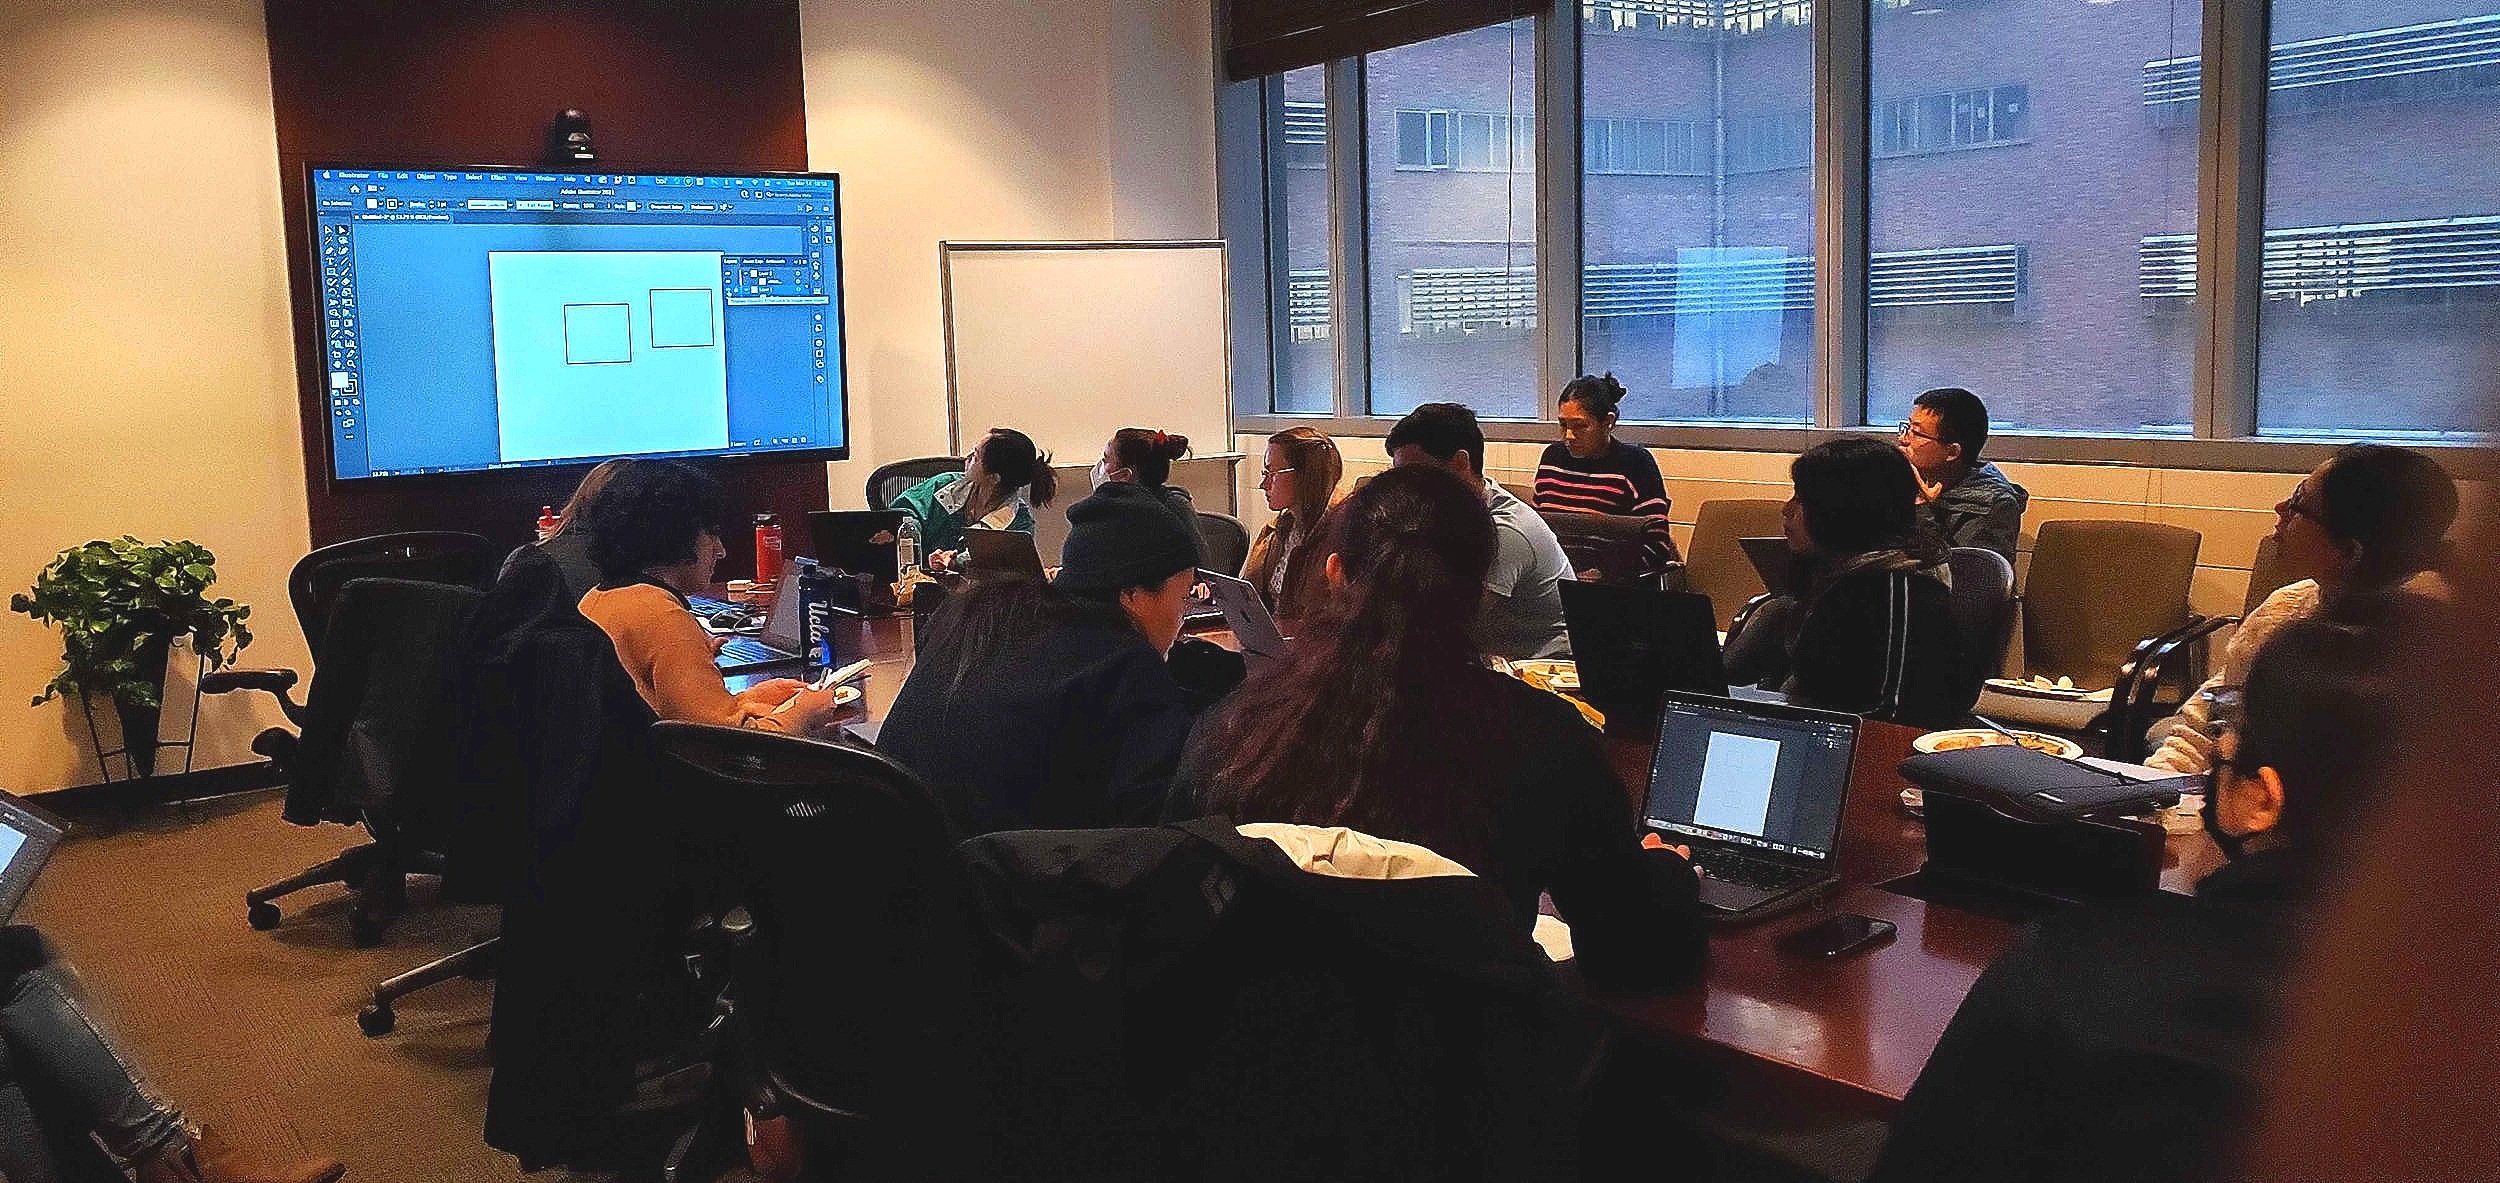
Visualizing Data workshop
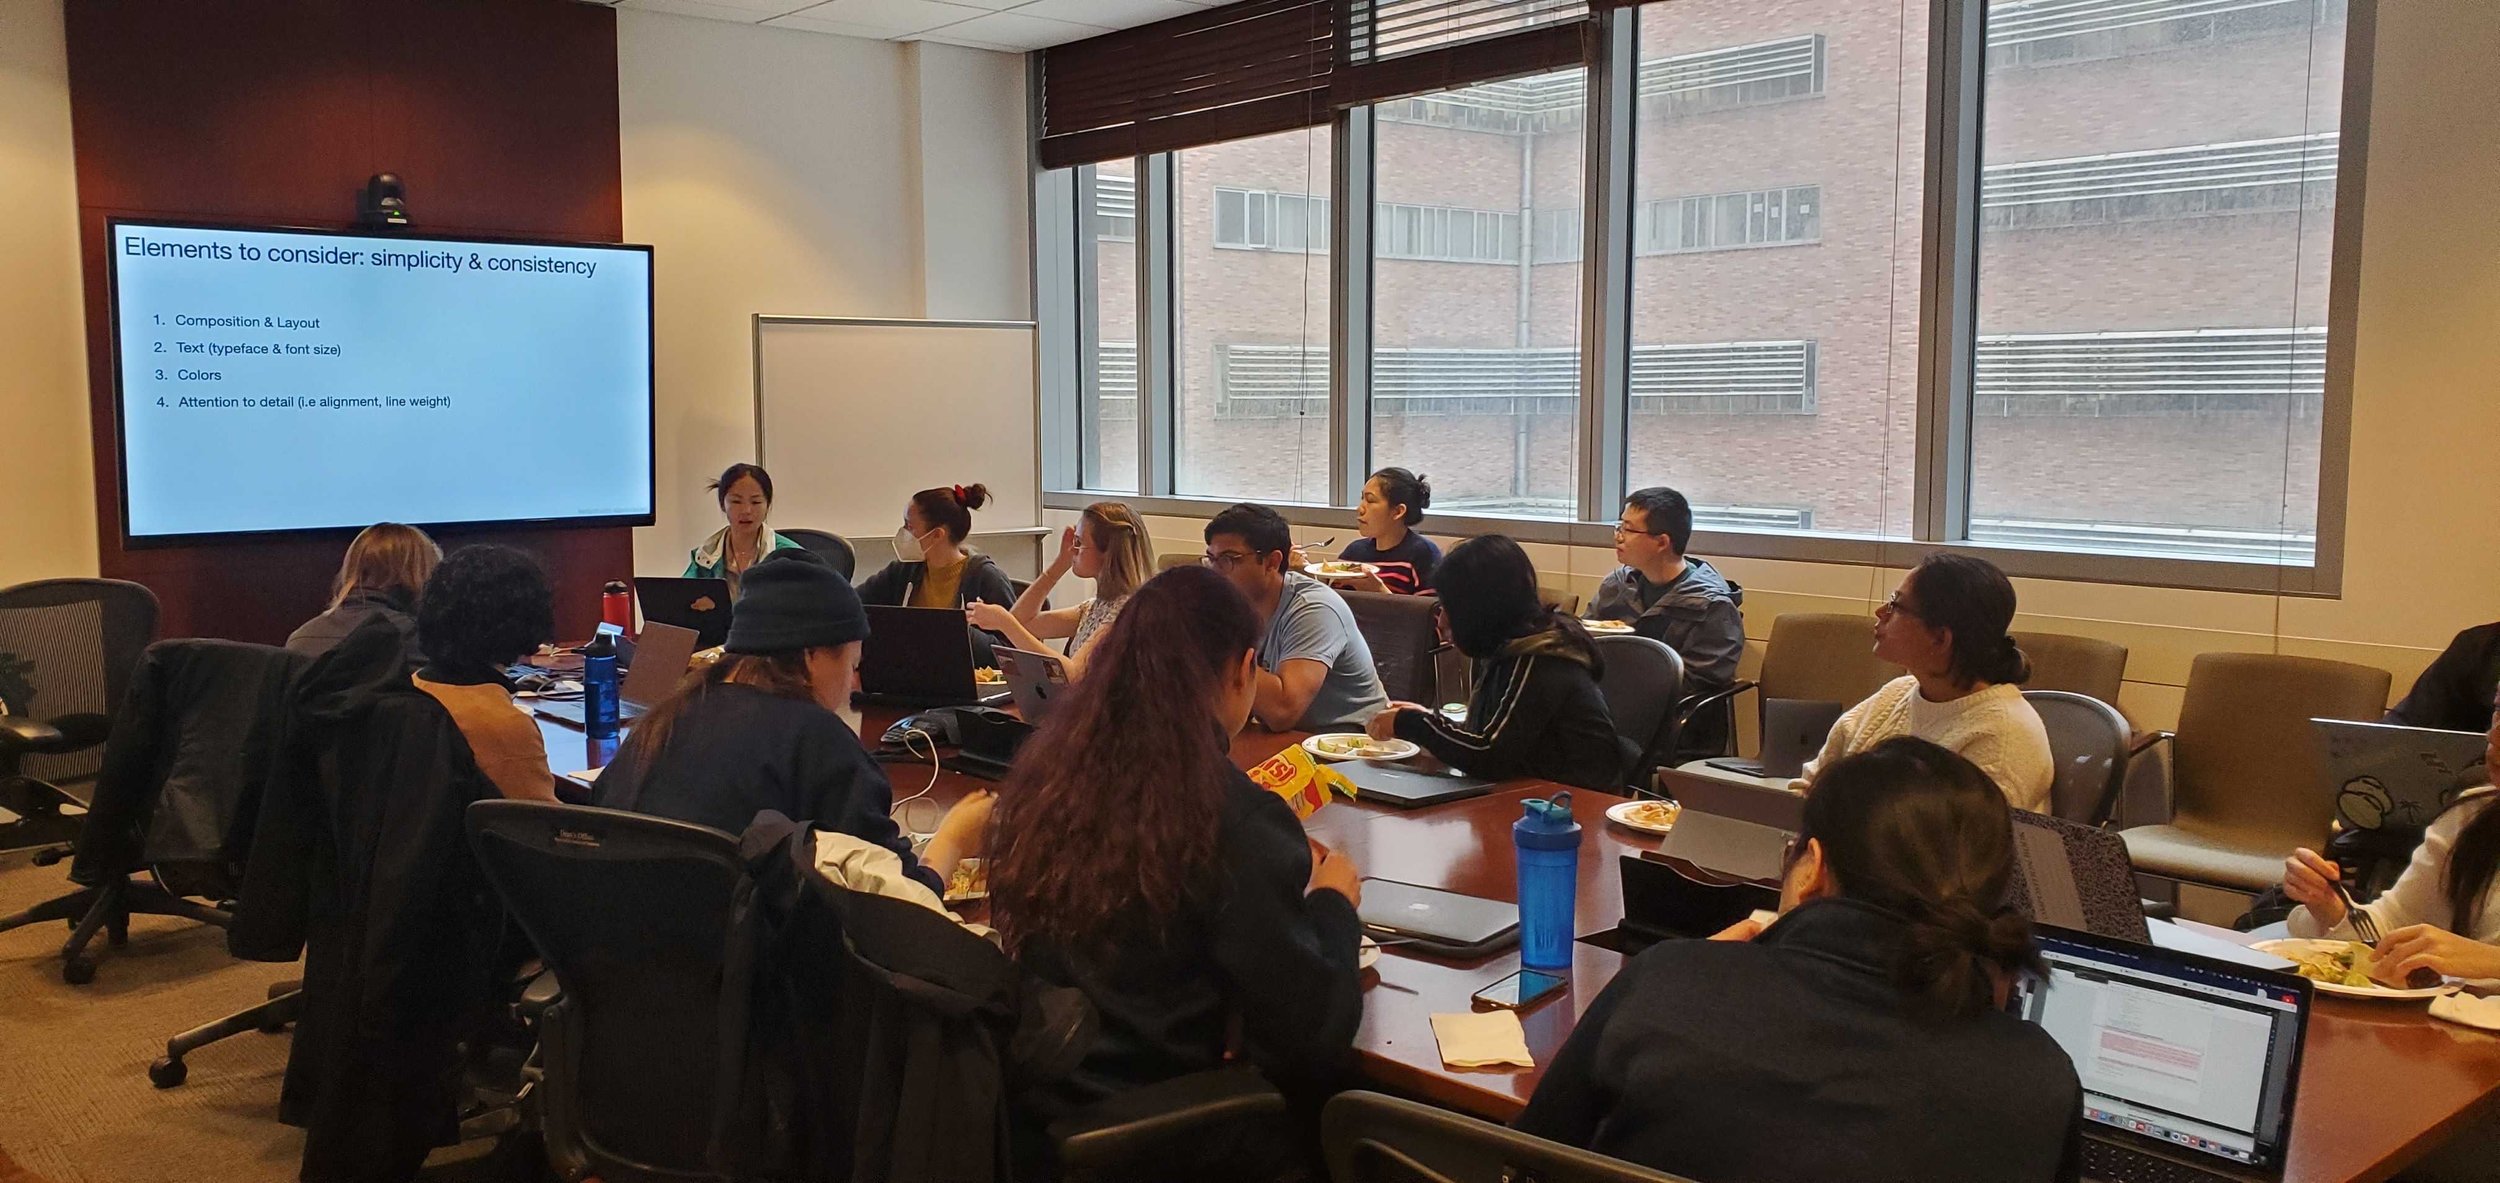
Part 1 of our series focused on making impactful visualizations of data and research.
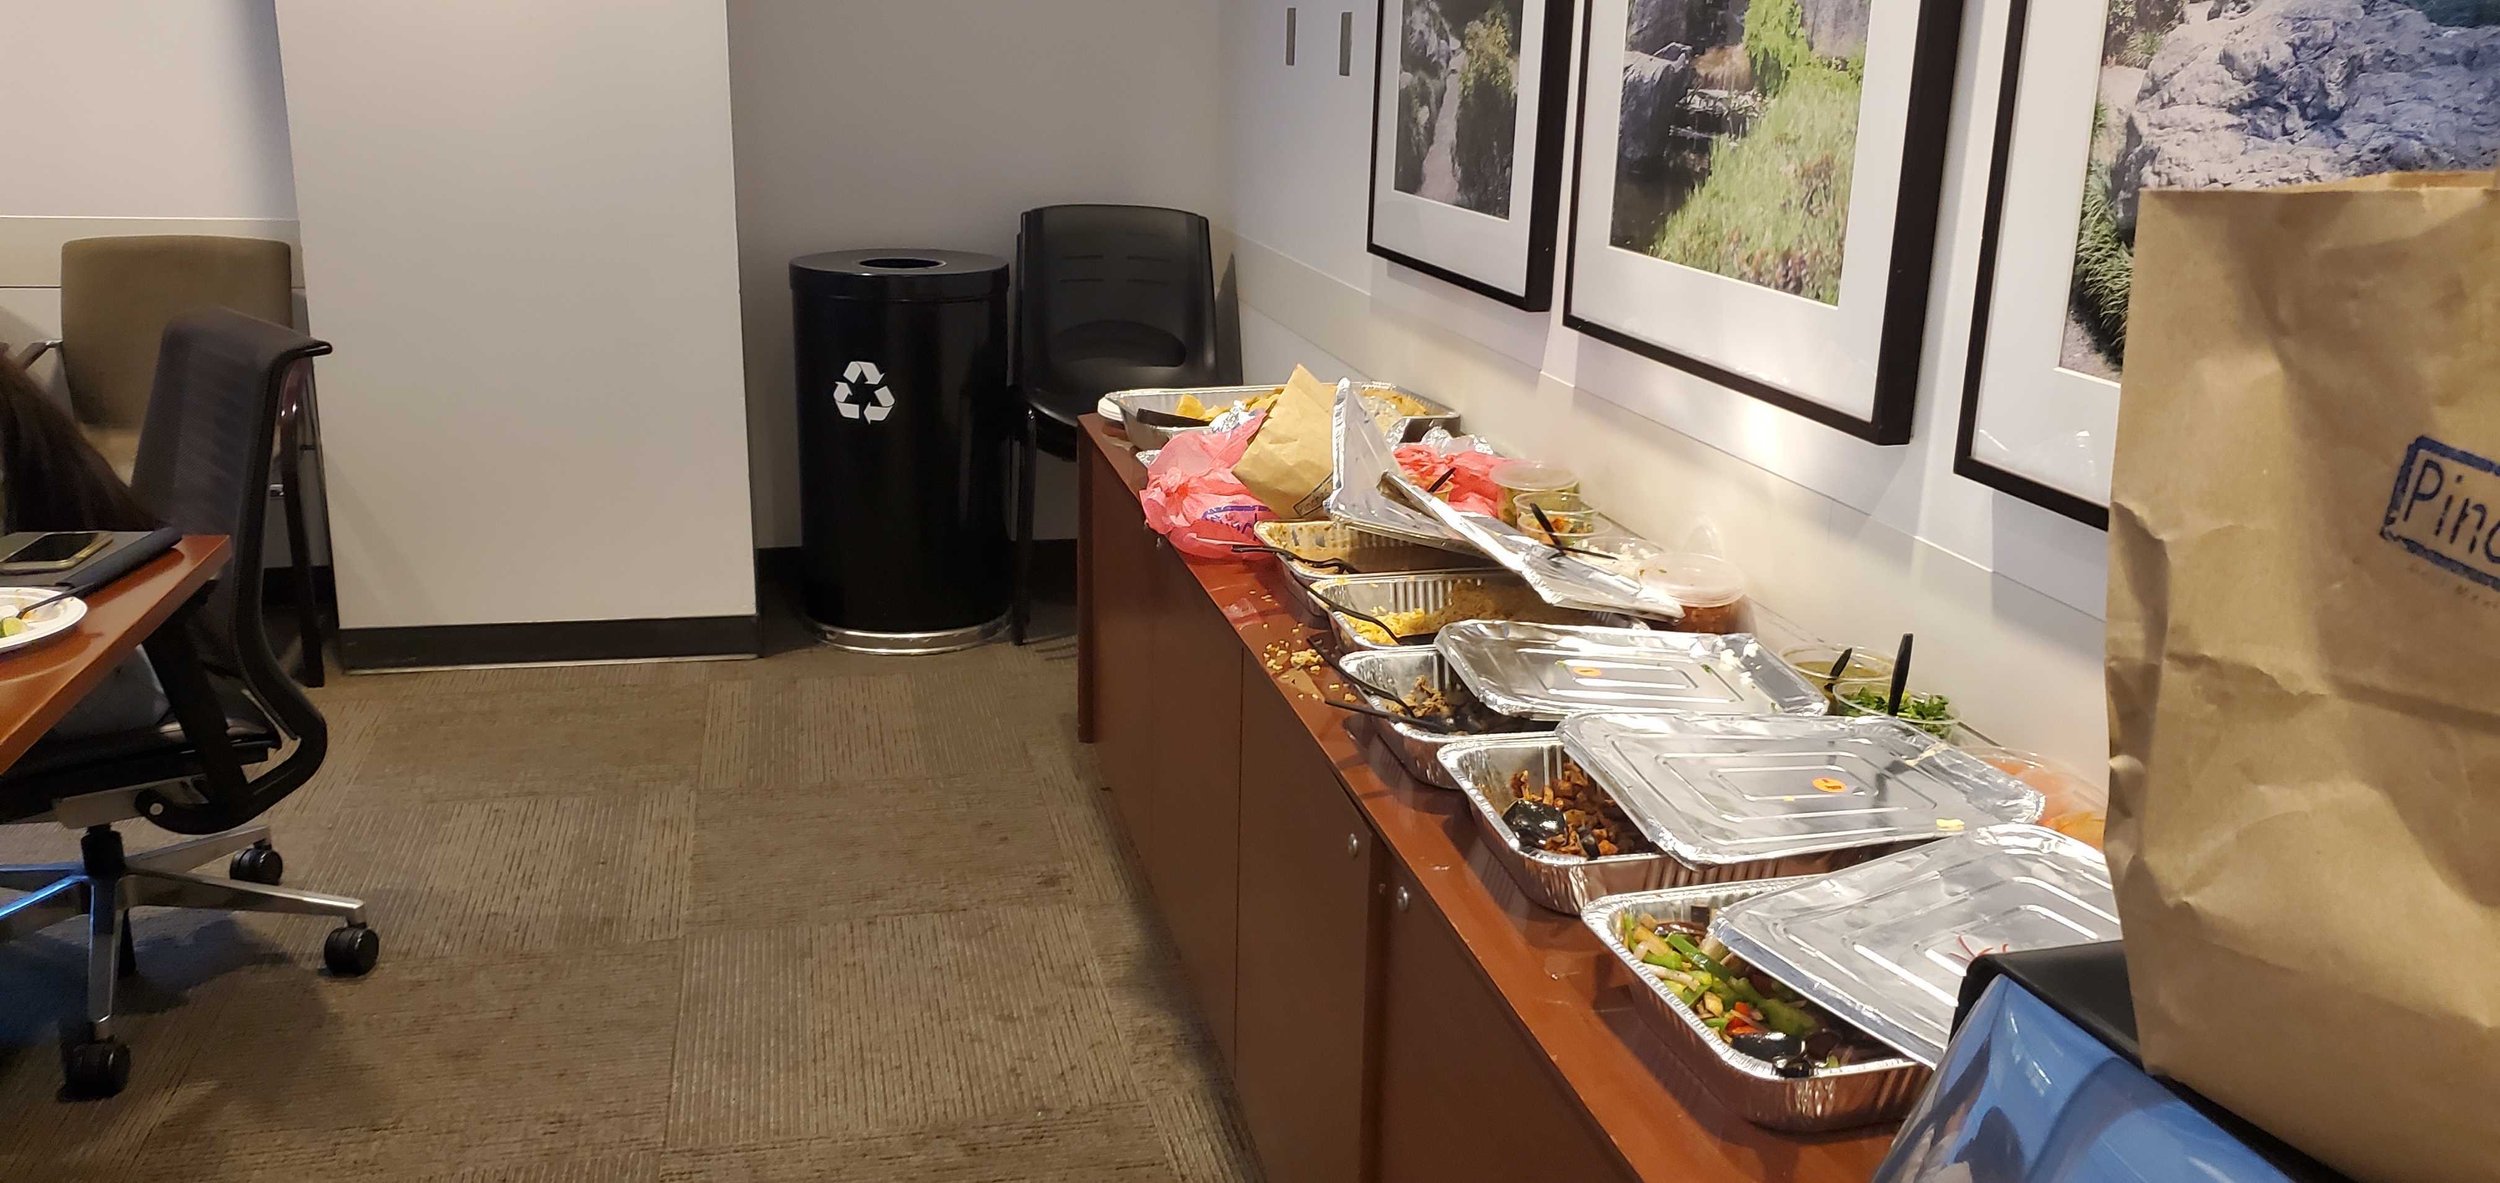
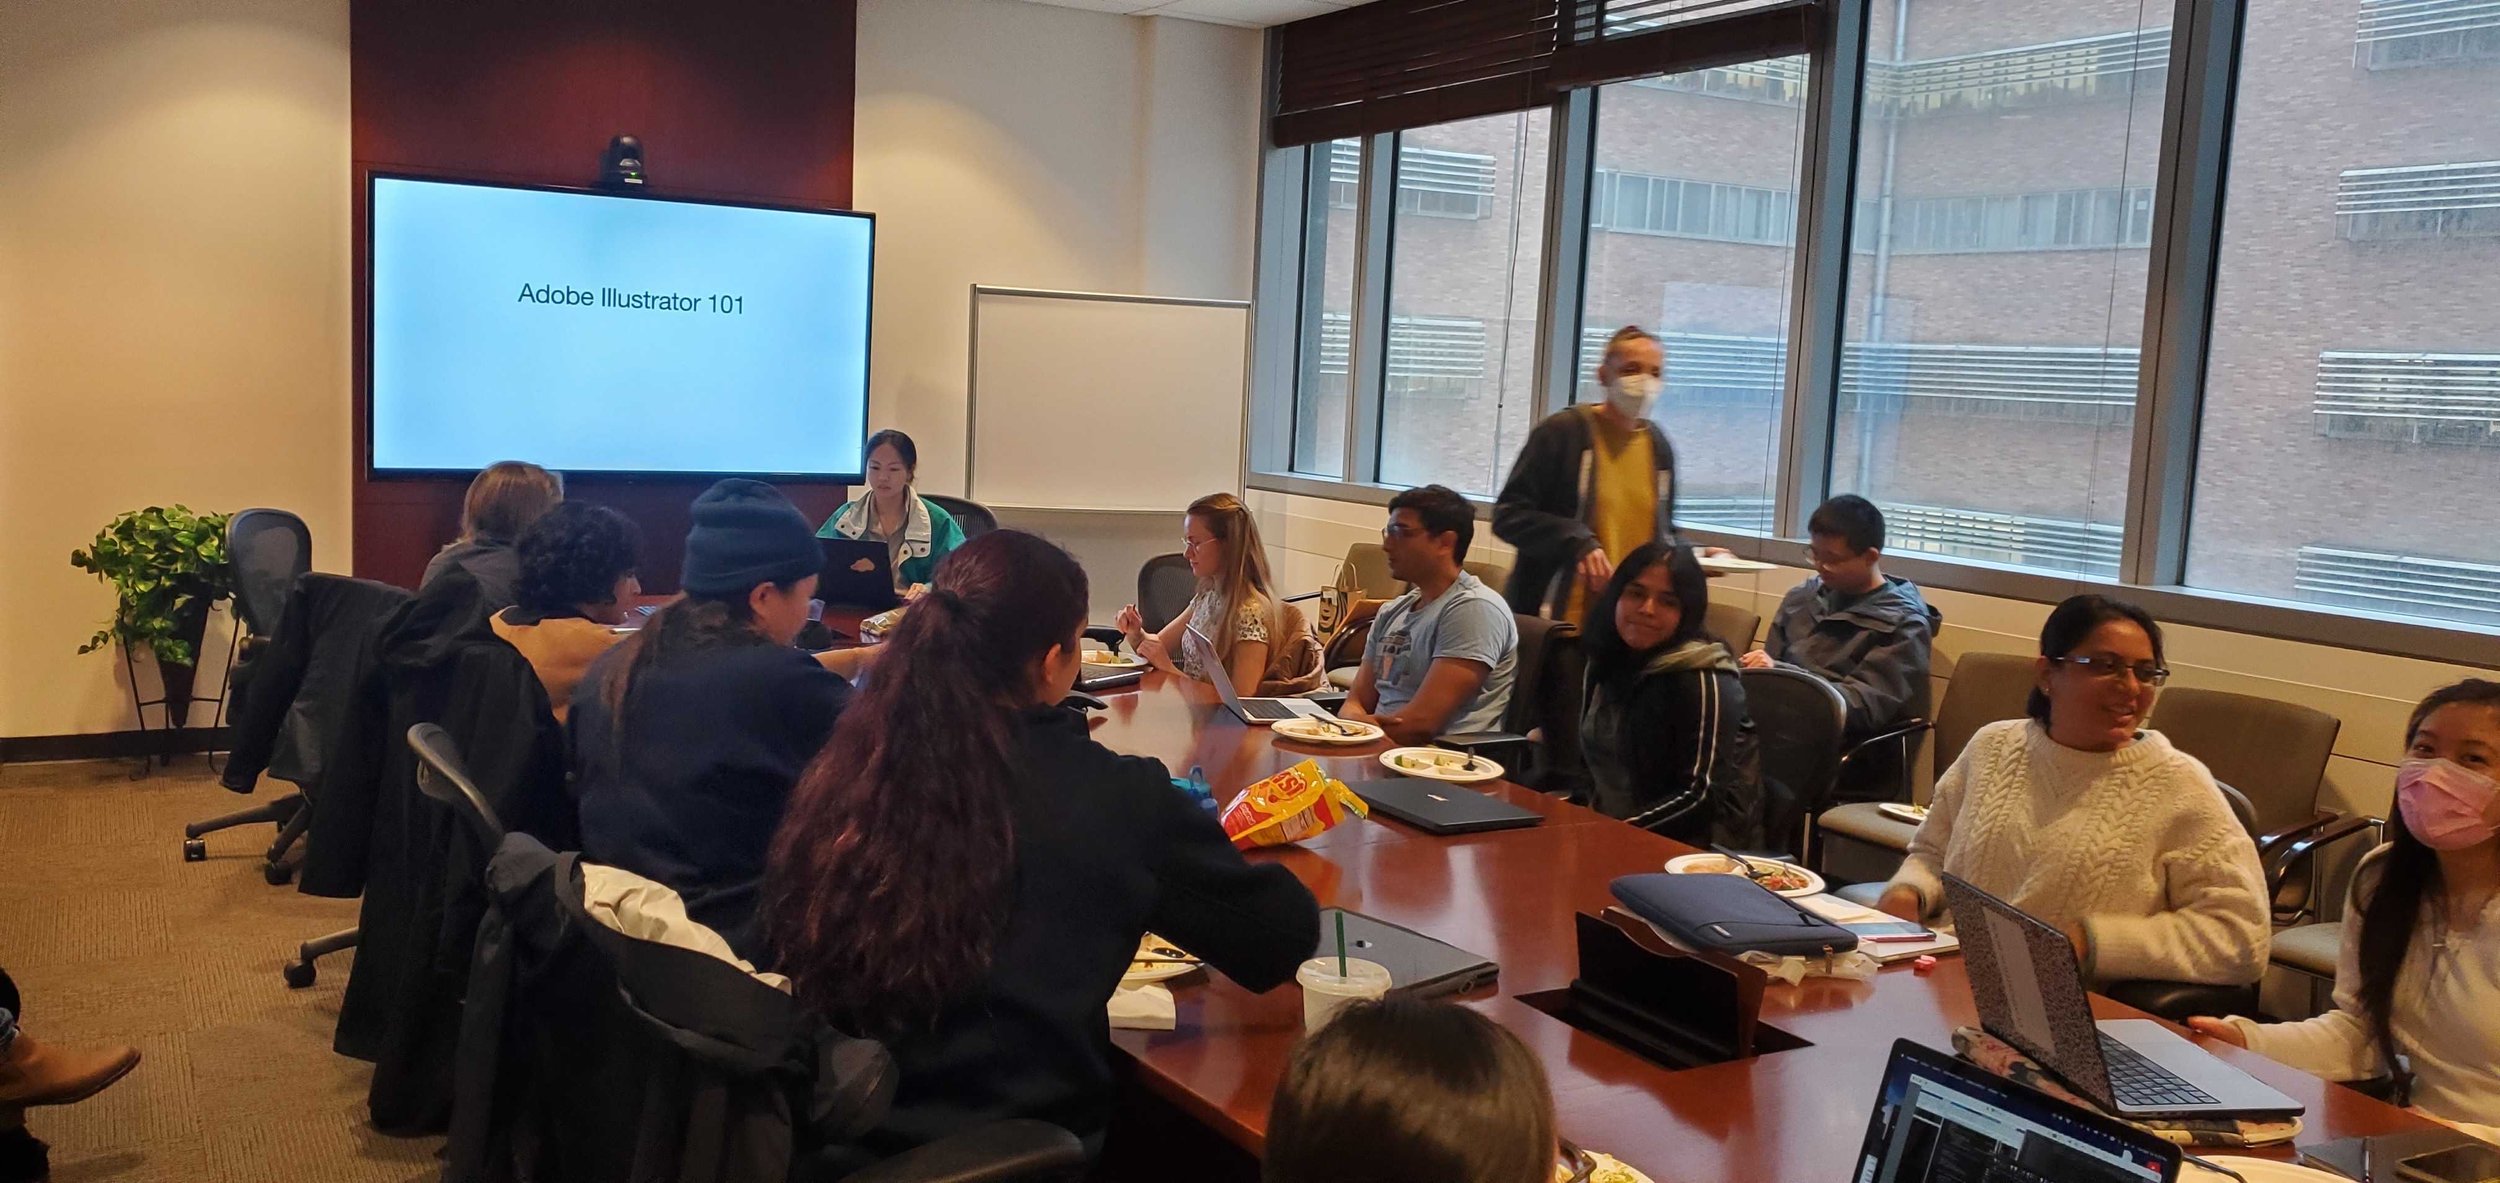
We got food from Pinches Tacos and held an interactive workshop on the general principles of effective visual communication and learnt the basics of Adobe Illustrator for figure-making, led by Co-President Kayla Lim!
Sponsored by: Research! America